
Price History Tools and What They Actually Tell You
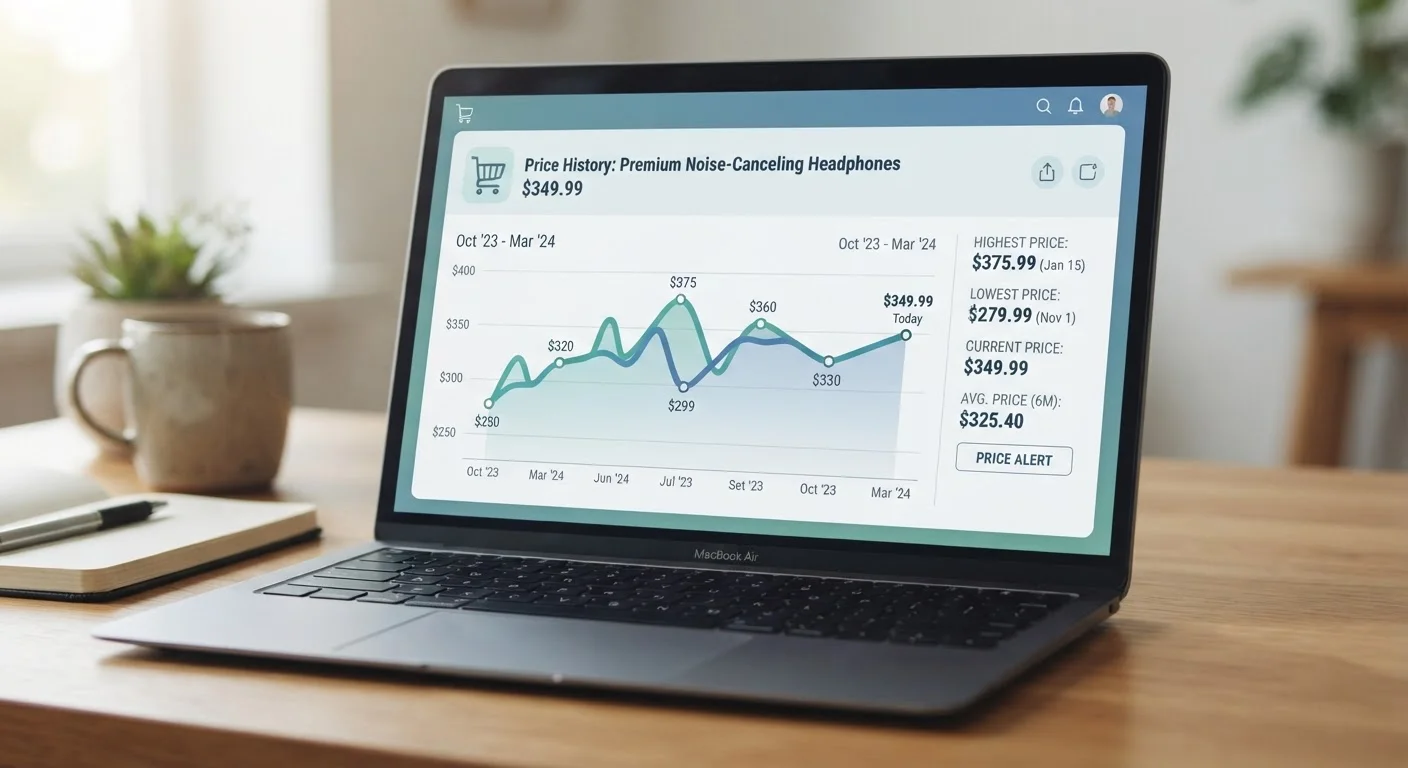
Photo credit: InsightsGrove.com | Discover Joy In Reading
In this article
A practical look at how price-tracking tools work, what their graphs reveal, and the limits of relying on them alone.
Key Takeaways
- Price history tools show past price trends, not whether a current price is objectively fair.
- A product's 'original' price on a graph may itself have been artificially inflated before a sale.
- Tools vary in how far back their data goes and how frequently they update - both affect reliability.
- Price history is one useful signal, not a complete purchasing decision on its own.
- Hidden costs like accessories and subscriptions won't appear on any price history graph.
How Price History Tools Actually Work
Price history tools work by automatically visiting product pages at scheduled intervals - sometimes hourly, sometimes daily - and recording the listed price. Over time, these data points accumulate into the line graphs you see when you install a browser extension or look up a product on a dedicated tracking site.
The graph is a log of what the retailer chose to display publicly at the moment the tool checked. That means it captures list prices, not prices after coupons, cashback, or private seller discounts. It also means data gaps appear whenever a product goes out of stock, gets a new listing ID, or the tool simply missed a check.
Understanding this mechanism is important because the graph looks authoritative - clean lines, clear highs and lows - but it is a record of publicly stated prices, not market truth. For a broader look at how pricing tactics work in practice, see our end-to-end guide on smart deal finding.
~30%
Portion of 'sale' prices that are not the lowest in recent history
Analysis of major retailer pricing data by consumer research organizations has consistently found that a significant share of promoted sale prices are not actually lower than prices seen in the preceding 90 days.
90 days
Typical reference window for meaningful price history
Consumer pricing researchers generally recommend reviewing at least 90 days of price history to distinguish genuine deals from short-term price fluctuations or anchored reference prices.
What the Graph Actually Tells You - and What It Doesn't
A price history graph answers one question well: has this product been listed at a lower price before? That is genuinely useful. If a product is currently $120 and the graph shows it has sat at $80 for most of the past year, the current price is not a deal - it's an outlier high.
What the graph does not tell you: whether the product's 'original' price was real to begin with. Retailers sometimes briefly list an item at an inflated price specifically to anchor that number in price history tools before running a 'sale.' The graph records it faithfully. This is a documented retail tactic - learn how artificially inflated reference prices work to understand the full picture.
The graph also says nothing about total ownership cost. A low unit price on a printer means little if the ink costs a multiple of the hardware price each year. Hidden costs that surface after purchase are invisible to any price history tool.
Set a Target Price, Not a Wait-Forever Strategy
Instead of watching a graph and hoping for an all-time low, use the historical median to decide the price you'd be satisfied paying. When the product hits that number, buy it. This avoids decision fatigue and the trap of waiting indefinitely for a price drop that may never come - or that arrives just as the product is discontinued.
How to Read a Price History Graph Without Being Misled
A few practical habits make price history graphs considerably more useful:
- Check data density. A graph with 300 recorded data points over 18 months is meaningful. One with 8 points is not. Sparse graphs often cover a product that was newly listed or rarely tracked - treat them with skepticism.
- Look at the median, not just the floor. The lowest price ever recorded might have been a one-day flash sale or a pricing error. The range where the product spends most of its time is a more honest benchmark.
- Note when the price history started. If a product was launched six months ago and the 'original' high only lasted two weeks at launch, that figure carries little weight.
- Cross-reference across retailers. Prices vary between platforms. A product that looks expensive on one site may sit at a normal price elsewhere. Some tools aggregate multiple retailers; single-retailer tools give an incomplete view.
For purchases where price-per-unit matters - groceries, cleaning supplies, paper goods - price history is less useful than understanding unit pricing, which gives you a direct comparison regardless of package size.
Using Price History as One Tool Among Several
Price history data is most valuable as a gut-check, not a decision engine. It can quickly flag when a hyped 'sale' is no different from the everyday price, or confirm that a current price genuinely is lower than the product has been listed in recent memory.
Pairing it with other methods sharpens the picture. Seasonal patterns - when certain product categories tend to see genuine price reductions - add timing context that a graph alone cannot provide. A practical approach to price tracking and purchase timing covers how to combine historical data with seasonal awareness without turning shopping into a second job.
The goal is informed confidence, not certainty. Price history tools reduce the chance of paying an inflated price during a manufactured sale. They do not eliminate uncertainty, and they don't replace judgment about whether a product meets your actual needs at any price. Use them as evidence, weigh that evidence alongside other signals, and make a call you can justify - rather than one driven by urgency or the visual authority of a downward-sloping line.
Price History Doesn't Account for Product Changes
Manufacturers sometimes quietly alter a product's specifications, materials, or included accessories between model runs while keeping the same product name and listing page. A price that looks like a historical low might reflect a revised - sometimes lesser - version of the original product. If a deal looks unusually good, it's worth checking whether the product description or user reviews mention any recent changes.
Frequently Asked Questions

Author
Savvy Shopping Editorial Team
Savvy Shopping Editorial Team is the collective byline for our editorial team and contributor network. Articles published under this byline or an editorial pen name are researched, written, and reviewed according to our editorial standards for clarity, consistency, and independence before publication.
View all articles →